
The Invisible Database Threat: Why PostgreSQL Monitoring Is Must
There’s an old saying in IT: “Everything works perfectly—until it doesn’t.”
A business-critical application is running smoothly. Users are navigating through the system without delays. Reports are generated in an instant. Then, without warning, the system slows down. What once took milliseconds now takes seconds, and soon after, queries start timing out. Complaints begin to surface. The once-reliable database has become unpredictable, and the worst part is that no one knows exactly why.
The immediate reaction is to investigate—check server logs, restart services, modify queries, and allocate more resources. But without visibility into what is happening inside the database, troubleshooting becomes a guessing game. Teams end up reacting to fires instead of preventing them. This scenario plays out far too often for organizations that rely on PostgreSQL without a structured monitoring system.
A properly monitored database does not just provide raw metrics—it enables proactive decision-making. When a database administrator (DBA) or developer can see trends, anticipate resource limitations, and analyze query execution, the risk of unexpected slowdowns and crashes is significantly reduced.
Understanding PostgreSQL’s Hidden Challenges
PostgreSQL is one of the most powerful open-source relational databases, known for its extensibility, robustness, and efficiency. It is built to handle large datasets and complex queries while maintaining reliability. However, like any software system, it has limitations that can impact performance if not monitored properly.
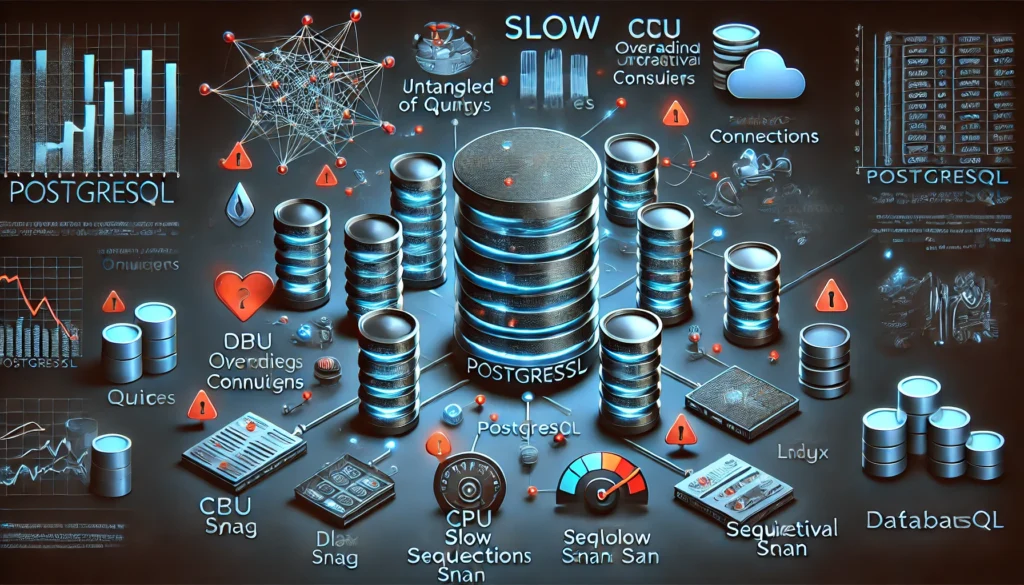
Some of the most common PostgreSQL performance issues occur gradually and without immediate warning signs:
- Unoptimized queries – Some queries consume excessive resources due to missing indexes, inefficient joins, or poorly written logic.
- Connection overload – Too many concurrent connections lead to contention, increasing response times.
- Growing disk usage – Log files, temporary tables, and unused indexes silently consume storage.
- High memory and CPU utilization – Queries competing for memory can slow down the entire system.
- Replication lag – Inconsistent data between primary and standby servers can lead to integrity issues.
- Slow indexing strategies – Queries that should be utilizing indexes may fall back on sequential scans, causing unnecessary performance degradation.
These issues do not announce themselves with flashing warning signs. They build up quietly, impacting performance over time until they reach a breaking point. By the time an administrator notices, the system may already be under strain.
The Role of Monitoring in PostgreSQL Performance
Effective PostgreSQL monitoring is not just about collecting numbers—it is about understanding what those numbers mean in context. Monitoring tools provide insights that help database teams:
- Detect slow-running queries before they affect user experience
- Optimize indexing strategies based on real-time query execution plans
- Track active connections and spot unusual spikes in load
- Observe system resource usage, including CPU, memory, and disk activity
- Analyze replication status to ensure failover nodes are up-to-date
- Prevent downtime by identifying performance bottlenecks before they escalate
A monitoring solution should go beyond PostgreSQL itself. Since database performance is closely tied to system resources, monitoring should include operating system metrics such as CPU load, memory utilization, disk read/write speeds, and network traffic. A high-performing database is not just about optimized queries—it also depends on a well-balanced infrastructure.
Proactive Monitoring vs. Reactive Troubleshooting
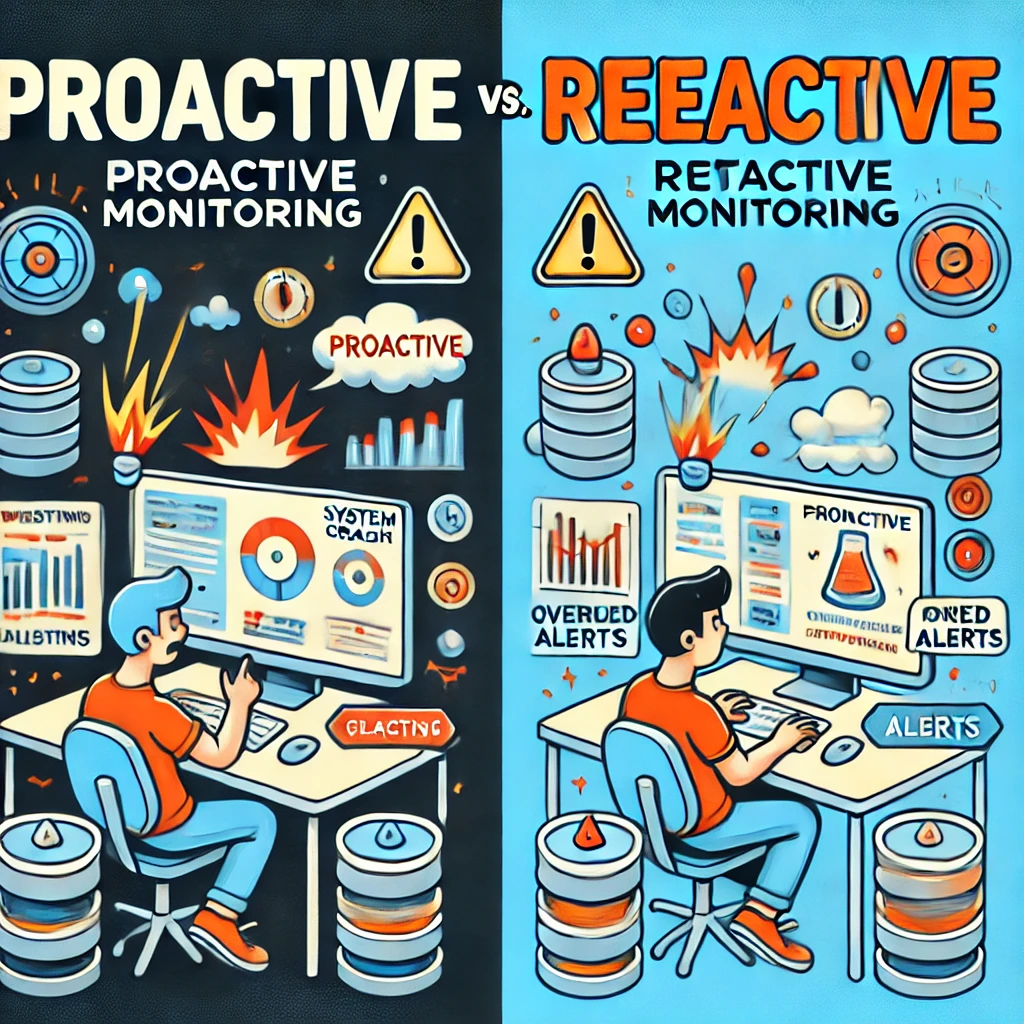
Many teams operate in a reactive mode when it comes to database performance. They wait until users report an issue, then scramble to find the cause. This approach leads to long resolution times and lost productivity.
A proactive monitoring approach, on the other hand, enables teams to detect anomalies early and address them before they become critical. By tracking database performance continuously, administrators can identify trends and patterns, such as:
- A slow increase in query execution time over weeks, indicating that tables need better indexing
- A rise in active connections every morning when users log in, suggesting a need for connection pooling adjustments
- A gradual increase in disk space usage due to growing logs, allowing for proactive cleanup before storage runs out
The ability to anticipate and address performance issues before they impact users is what separates high-performing systems from those that suffer from unpredictable slowdowns.
The Importance of Historical Data
Real-time monitoring provides immediate insights into what is happening at any given moment, but historical data analysis is equally important. Looking at trends over time can help administrators make informed decisions about capacity planning, indexing strategies, and infrastructure upgrades.
Some of the key benefits of historical performance data include:
- Identifying performance degradation trends and fixing them before they impact operations
- Understanding how database load varies by time of day, helping with workload distribution
- Detecting long-term patterns in query execution times, guiding indexing decisions
- Analyzing past failures to prevent similar incidents in the future
Without historical data, every performance optimization decision is based on assumptions rather than facts. Storing and analyzing past performance metrics gives database teams a powerful tool to refine and improve PostgreSQL efficiency over time.
The Future of PostgreSQL Monitoring
As databases become more complex, the role of monitoring tools will continue to evolve. The next generation of monitoring solutions will integrate machine learning and artificial intelligence to provide even deeper insights.
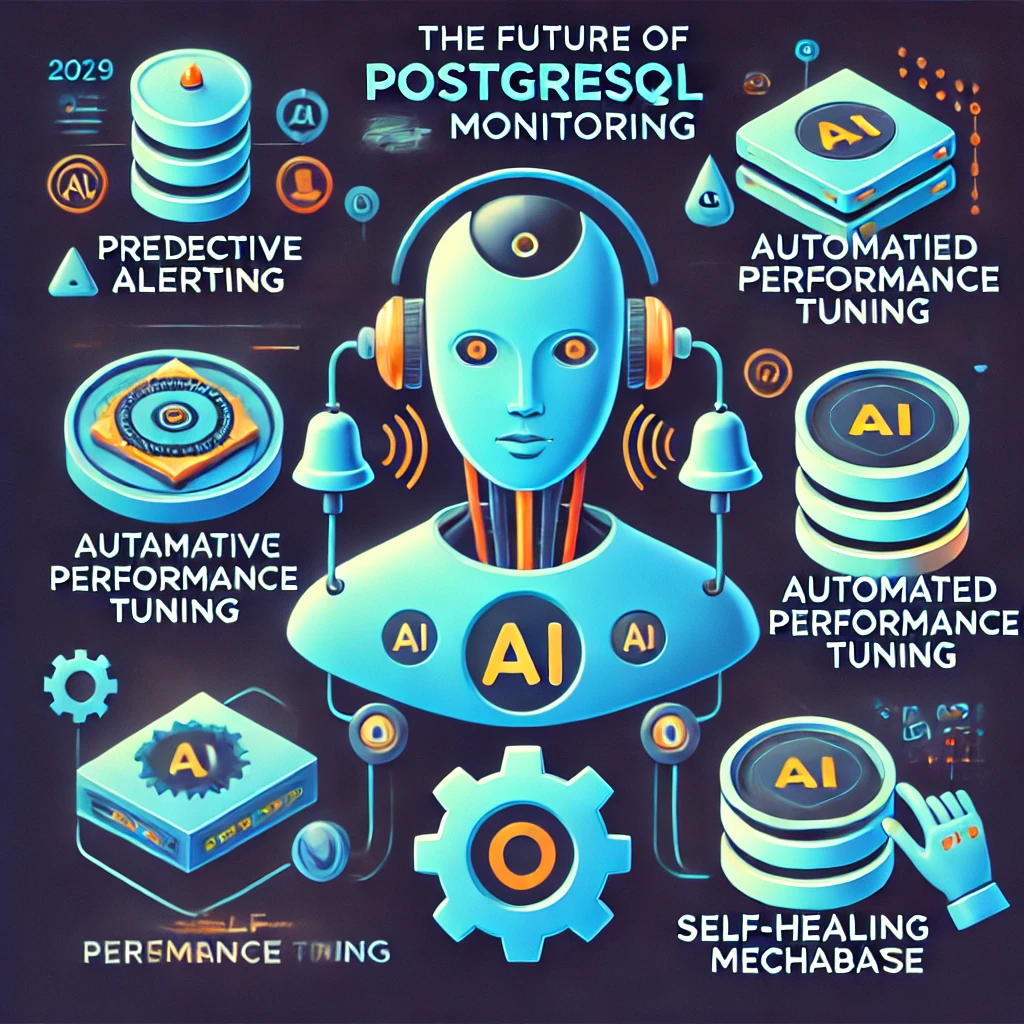
Future monitoring tools may include:
- Automated performance tuning– AI-driven suggestions for indexing strategies, query optimizations, and workload balancing.
- Predictive alerting– Early warnings about potential performance issues before they impact users.
- Self-healing mechanisms– Automated responses to detected anomalies, such as dynamically increasing available memory or restarting slow queries.
- Multi-node cluster insights– Improved monitoring of distributed PostgreSQL setups with automatic detection of replication lag and failover readiness.
While AI-driven database monitoring is still in its early stages, the shift toward automation is inevitable. The goal is to reduce the manual workload for administrators while ensuring databases remain highly available and optimized.
Why PostgreSQL Monitoring Should Be a Priority
Databases are the backbone of modern applications, and their performance directly affects user experience, system reliability, and business outcomes. PostgreSQL, despite its power and scalability, requires continuous monitoring to maintain peak efficiency.
With the right monitoring approach, teams can:
- Reduce downtime and improve application stability
- Detect performance issues before they affect users
- Optimize database queries and indexing strategies
- Track infrastructure usage to prevent resource bottlenecks
- Scale PostgreSQL deployments with confidence
A well-monitored database is not just more reliable—it is also more cost-efficient. By catching issues early and optimizing performance, organizations can avoid costly downtime, reduce infrastructure overhead, and maintain a seamless user experience.
Ignoring database monitoring is a risk that no team should take. A proactive approach ensures that PostgreSQL remains a high-performance, mission-critical component of any technology stack.