Introduction
Replication is a critical feature of PostgreSQL that ensures data is available across multiple servers, providing high availability, load balancing, and disaster recovery. However, replication lag can disrupt operations, leaving standby servers out of sync with the primary database. Resolving replication lag requires understanding its causes, monitoring replication metrics, and implementing best practices for optimal performance. This article delves into the common causes of replication lag, effective monitoring strategies, and solutions to address these issues.
Understanding Replication and Lag in PostgreSQL
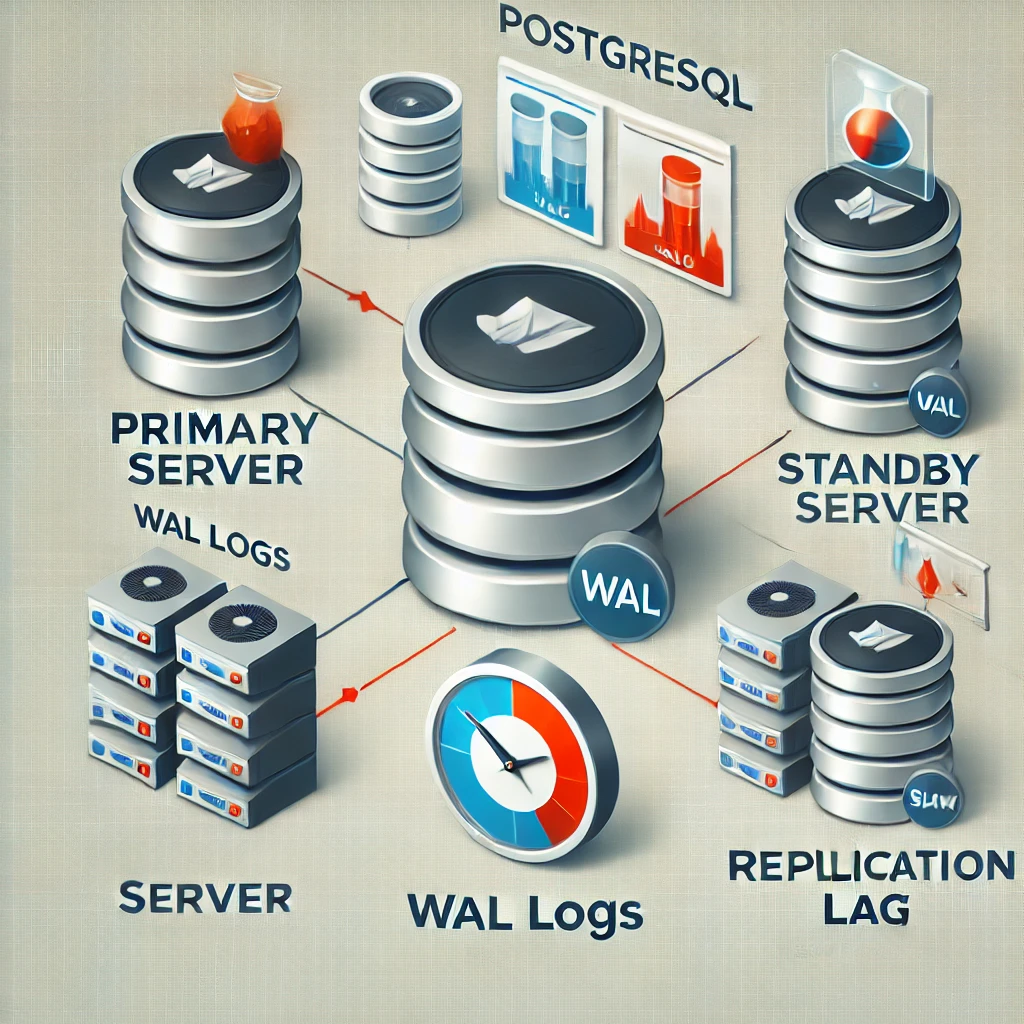
PostgreSQL uses Write-Ahead Logging (WAL) for replication. The primary server generates WAL files, which are sent to standby servers to replay and replicate changes. Replication lag occurs when standby servers cannot keep up with the primary server, leading to data inconsistencies.
Types of Replication in PostgreSQL:
Streaming Replication:
WAL files are streamed to standby servers in real time.
Most commonly used for high availability.
Logical Replication:
Replicates data changes at the logical level (e.g., tables or specific changes).
Useful for selective replication or cross-version replication.
Asynchronous vs. Synchronous Replication:
Asynchronous: Standby servers lag behind the primary server but offer better performance.
Synchronous: Guarantees that standby servers are up-to-date but may introduce latency.
Common Causes of Replication Lag
High Write Workload on the Primary Server:
The primary server generates WAL files at a high rate, overwhelming the standby server.
Network Latency or Bandwidth Issues:
Slow or unreliable networks delay the transfer of WAL files to standby servers.
Slow Disk I/O on Standby Servers:
Standby servers with insufficient disk performance struggle to apply WAL changes quickly.
Resource Contention:
High CPU, memory, or I/O usage on standby servers can slow down WAL replay.
Misconfigured Replication Settings:
Inefficient parameters, such as small
wal_buffersor improperly tunedmax_wal_size, can cause replication delays.
Checkpoint and Vacuum Activity:
Excessive checkpointing on the primary server generates large WAL files, increasing lag.
Overloaded Standby Servers:
Running read-heavy queries or maintenance tasks on standby servers can delay WAL replay.

Monitoring Replication Lag in PostgreSQL
Effective monitoring is crucial for identifying and resolving replication lag. PostgreSQL provides built-in tools and views to track replication performance.
Key Metrics to Monitor:
Replication Lag:
Use the
pg_stat_replicationview on the primary server:SELECT client_addr, state, sent_lsn, write_lsn, flush_lsn, replay_lsn, write_lag, flush_lag, replay_lag FROM pg_stat_replication;write_lag,flush_lag, andreplay_lagindicate the delay at each stage.
WAL Activity:
Monitor the WAL file generation and application rate using
pg_stat_wal:SELECT * FROM pg_stat_wal;
Network Metrics:
Check network bandwidth, latency, and packet loss between the primary and standby servers.
System Resource Utilization:
Use tools like
vmstat,iostat, or PostgreSQL’spg_stat_activityto monitor CPU, memory, and disk I/O usage.
Third-Party Monitoring Tools:
Prometheus + Grafana: Create dashboards for replication metrics.
pgAdmin: Visualize replication status.
Percona Monitoring and Management (PMM): Comprehensive database monitoring.
Solutions to Resolve Replication Lag
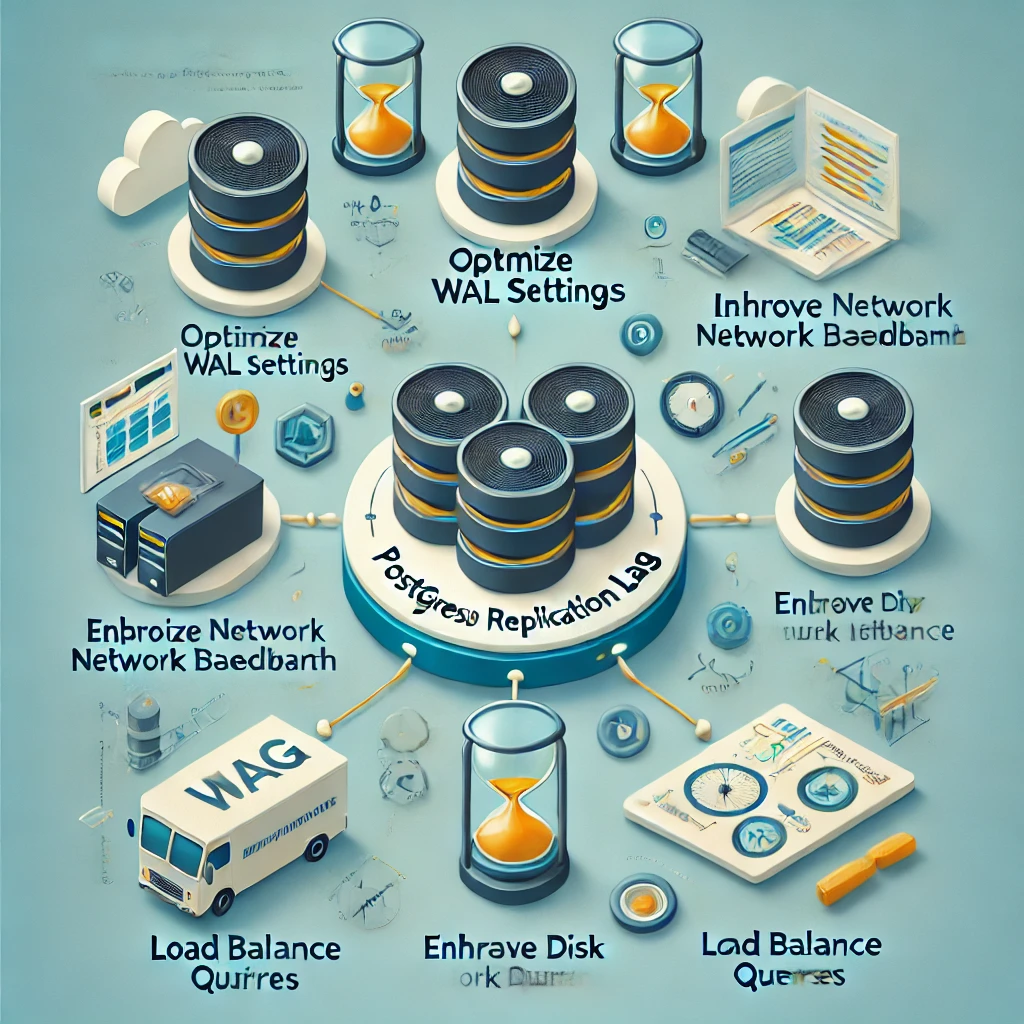
1. Optimize WAL Settings
Tune WAL Buffers:
Increase
wal_buffersto reduce disk writes and improve WAL transfer efficiency.Example:
wal_buffers = 16MB
Adjust WAL Segment Size:
Configure
wal_segment_sizeandmax_wal_sizeto handle workloads efficiently.Example:
max_wal_size = 2GB
Enable WAL Compression:
Compress WAL files to reduce network transfer time.
Example:
wal_compression = on
2. Improve Network Performance
Use a High-Speed Network:
Upgrade to faster network connections (e.g., Gigabit Ethernet).
Reduce Network Latency:
Use tools like
pingortracerouteto diagnose latency issues.Optimize network routes or deploy standby servers closer to the primary server.
3. Enhance Disk Performance
Upgrade Disk Hardware:
Use SSDs for faster WAL application on standby servers.
Optimize Disk I/O:
Monitor disk usage with
iostatand resolve bottlenecks.Increase the
maintenance_work_memparameter for smoother WAL replay.
4. Tune Checkpoint Settings
Reduce Checkpoint Frequency:
Adjust
checkpoint_timeoutandcheckpoint_completion_targetto reduce WAL file generation.Example:
checkpoint_timeout = 10min
checkpoint_completion_target = 0.9
5. Load Balance Read Queries
Use a Connection Pooler:
Tools like PgBouncer or Pgpool-II can distribute read workloads across standby servers, reducing contention.
Prioritize WAL Replay:
Limit read-heavy queries on standby servers during high WAL replay activity.
6. Scale Horizontally
Add More Standby Servers:
Distribute replication workload across multiple standby servers.
Use Cascading Replication:
Replicate from an existing standby server to reduce the load on the primary server.
7. Monitor and Adjust Synchronous Replication
Switch to Asynchronous Replication (if applicable):
Reduce latency by allowing the primary server to proceed without waiting for standby acknowledgment.
Optimize Synchronous Commit:
Adjust the
synchronous_commitsetting for better performance.Example:
synchronous_commit = remote_write
8. Implement Logical Replication
Selective Replication:
Use logical replication to replicate only required tables or changes, reducing data transfer overhead.
Upgrade Standby Servers:
Ensure standby servers are running the same or higher version of PostgreSQL.

Preventive Measures
Regularly Monitor Replication Metrics:
Automate alerts for replication lag exceeding a defined threshold.
Perform Routine Maintenance:
Vacuum and analyze both primary and standby servers to prevent bloat.
Test Disaster Recovery Plans:
Periodically validate failover procedures to ensure standby servers are ready to take over.
Keep Software Updated:
Use the latest PostgreSQL version with performance and replication improvements.
Conclusion
Replication lag in PostgreSQL can disrupt data consistency and availability, but with proper monitoring, tuning, and maintenance, it is manageable. By addressing common causes such as high write workloads, network issues, and disk bottlenecks, you can minimize replication delays and ensure standby servers remain in sync with the primary database. Continuous monitoring, coupled with best practices, will help maintain a reliable and efficient PostgreSQL replication setup.
